- The Trading Initiative
- Posts
- 6 Charts In 60 Seconds
6 Charts In 60 Seconds
The markets are screaming higher, but is it sustainable?
Hamilton D
September 23, 2024
Stocks Go Up in Bull Markets
At least that’s how it’s worked over the last 100+ years.
And that’s exactly what we’re continuing to see as of last Friday’s close.
Just check out the S&P 500 closing at all-time highs:

S&P 500, SPY, Daily Timeframe
Worried about market breadth?
A majority of the stocks within the S&P 500 are reaching into new 52-week and all-time highs.
Just check out its equal weighted equivalent, which also closed at all-time highs:

Equal Weighted S&P 500, RSP, Daily Timeframe
Worried about the strength of the trends?
The short, intermediate and long-term trends are confirming this thrust into new highs with >70% trading above key moving averages.
Just check out how many stocks within the S&P 500 are trading above their 20, 50 and 200-day moving averages:

S&P 500 Stocks Above 20, 50, 200-Day Moving Averages
Worried about the largest stocks in the market underperforming?
Mega cap stocks such as Amazon, Microsoft, Meta and more are poised to break out into all-time highs.
Just check out the entire Mag-7 index, bouncing off of its 200-day moving average, and less than 5% away from all-time highs:
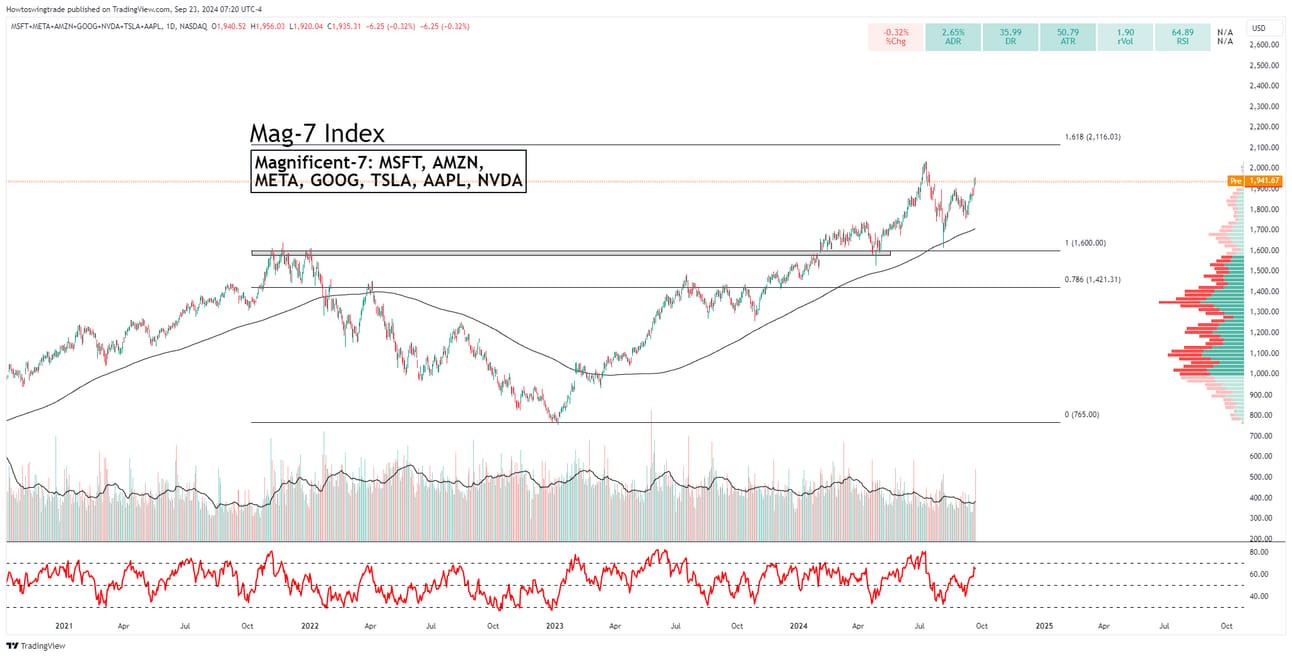
The Mag-7 Index, Daily Timeframe
Worried about how the Dollar may impact the future moves in the market?
The Dollar is finding support near 2-year low, within a bearish momentum regime, and potentially breaking into a new stage-4 downtrend.
As an investor, would you rather own a falling dollar (with falling yields, thus making less on your savings), or rising stocks?
Just check out the Dollar index and how its moved since the Federal Reserve began cutting interest rates:

US Dollar Index, DXY, Daily Timeframe
Worried about the state of risk in the market?
A basket of commonly risk-on assets versus a basket of commonly risk-off assets gives us an understanding of the type of risk appetite large financial institutions are willing to take.
Just check out our Risk-On/Risk-Off assets chart:

Risk-On / Risk-Off, Daily Timeframe
The Bottom Line
The weight of the evidence continues to suggest that we are within a bull market and poised to fly higher.
Whether or not it happens in a straight line is anyone’s call, but we are maintaining our bullish outlook through the end of the year and expect the S&P 500 to close higher than it is today.
Shorting all-time highs is a tough way to make a living in this market.
As is sitting on the sidelines waiting for stocks to dip before buying.
Instead, focus on owning the strongest stocks at the right prices for high risk-to-reward trades.
That’s exactly what we focus on, and we invite you to find out for yourself.
Cheers,
Hamilton